Nathan Richardson is the founder and managing editor of Advisement.com.
Car Ownership Statistics
There are a total of 29.8 million vehicles registered in the U.S. as of 2022. Trucks are the most popular vehicle owned by Americans, with cars coming in second place before buses and motorcycles. This data is taken from federal sources including…
Statistics & Studies
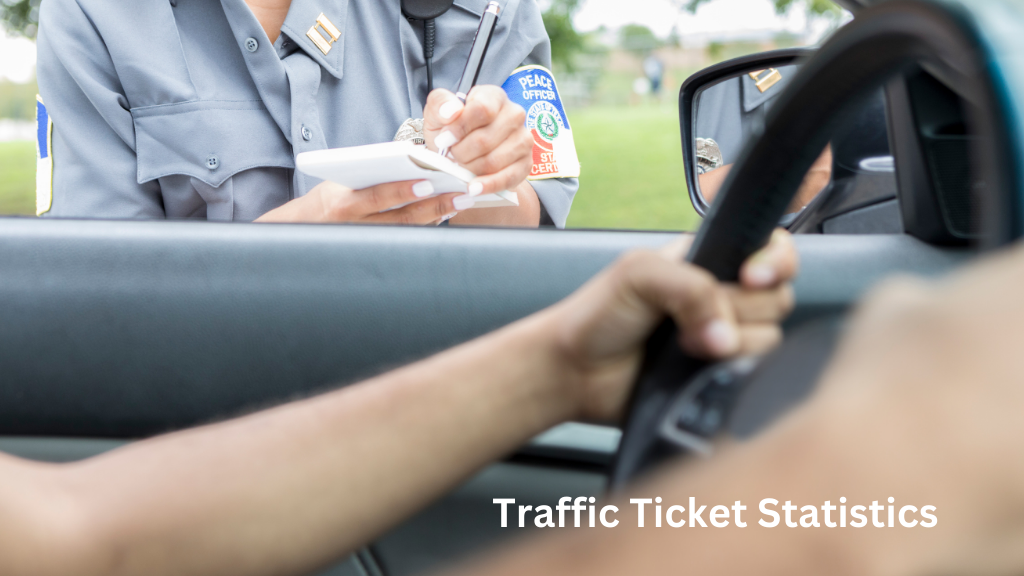
Millions of traffic tickets are issued every year in the U.S. The average cost per traffic ticket is around $150. Depending on the offense and jurisdiction, however, this amount can often exceed this average. Traffic tickets generate billions of dollars a year…
Statistics & Studies
At least 8 people died and 9,700 others were injured in firework accidents in 2023 alone. Out of the 9 deaths, 6 of them were involved in the misuse of fireworks, 2 were killed because of unknown fireworks accidents, and 1 was…
Dangerous Holidays for Drunk Driving
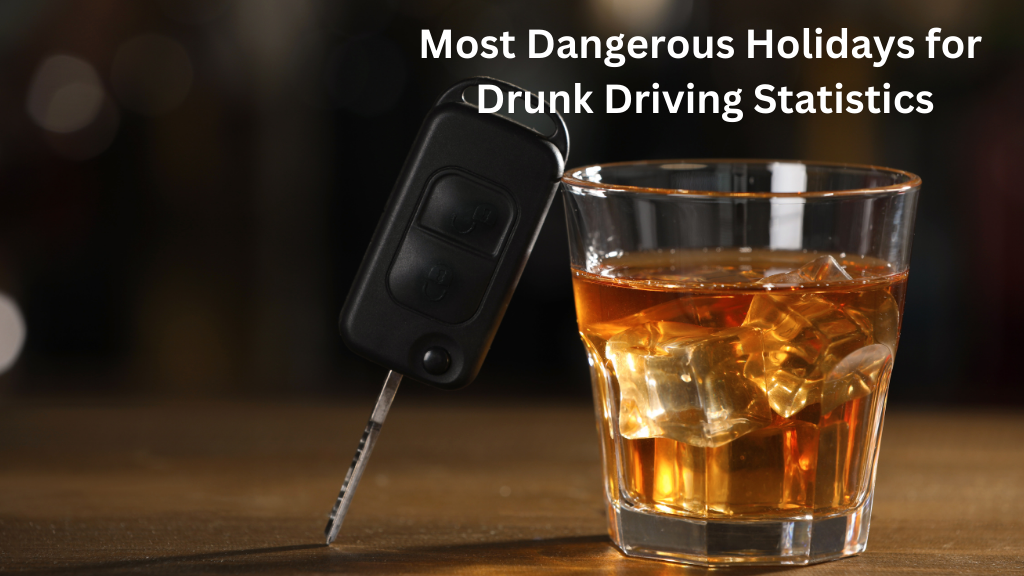
Statistics show that one of the most dangerous times for drivers is the week between Christmas and New Year’s Day. One of the main reasons for this is alcohol usage. To have a better understanding of drunk driving trends during the holiday,…
Distracted Driving
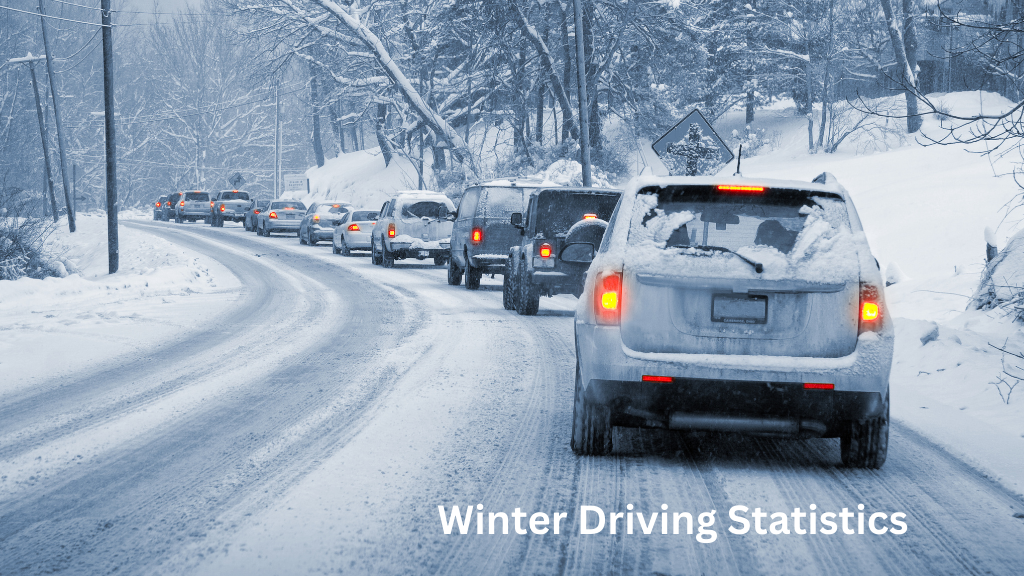
Nearly 70% of the U.S. population lives in regions that receive an average of 5 inches (13 cm) of annual snowfall. Snow and icy roads reduce pavement friction which leads to an increase in traffic fatalities. According to statistics, people slow down…
Statistics & Studies
An average of 2.8 workers out of 100 get injured every year in workplace accidents in the U.S. This costs the U.S around $250 billion each year. In 2019, there were 2.8 million injuries and nonfatal workplace accidents according to the U.S.…
Burglary statistics
About 2.5 million burglaries happen annually in the U.S. According to the United States Department of Justice, 50% of these burglaries are forced entry home invasions. While these might seem like frightening numbers, these rates are at a drop when compared to…
Car Repossession
About 44% of Americans are in debt over auto loans. Between 2017 and 2018 alone, American loans totaled 568.6 billion dollars. These are unhealthy signs for the economy and also increase the number of car repossessions across the U.S. This article reveals…
Motorcycle Crashes
Up to 6,218 motorcyclists were killed in 2022 alone. This was 23% higher than 2019, and was, in fact, the highest number of annual fatalities ever recorded. 15% of all vehicle deaths are motorcycle deaths. This article has analyzed national data and…
Statistics & Studies
The car insurance industry is worth $353 billion in 2023 alone. About 215 million Americans currently pay car insurance. More than one-third of them have had an accident in the past three years leading up to their current policy. The data and…
Uninsured Motorist
Auto insurance is required by law by the Department of Motor Vehicles in most states of the U.S. This coverage however, is not bought by everyone that owns or drives a car. Getting into a car accident with an uninsured driver can…
Seat Belt Statistics
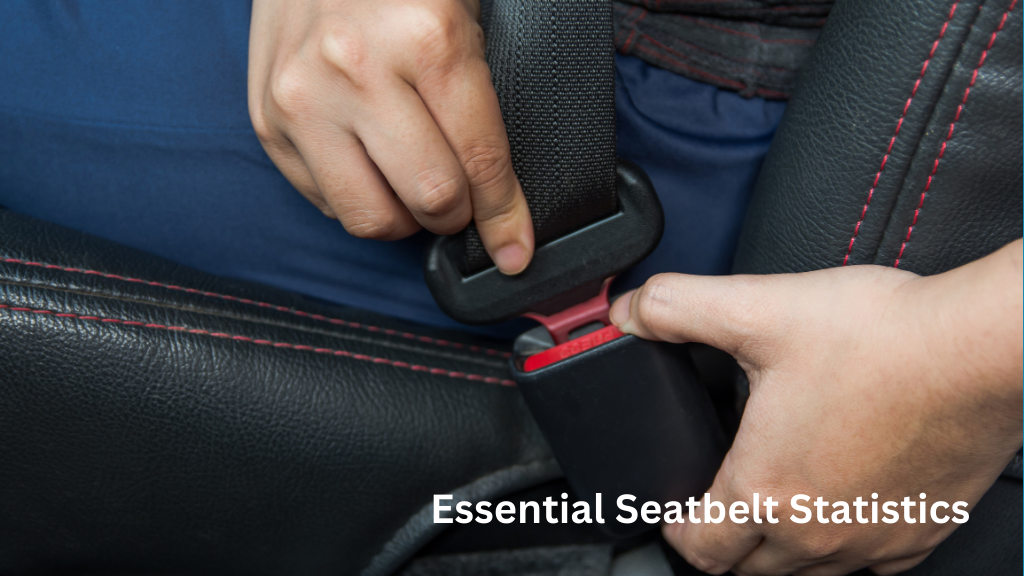
Out of 20,000 deaths that take place from car-related accidents, 51% are not wearing seat belts. In 2017 alone, seat belts saved more than 14,500 lives. The data and statistics in this article have been compiled from trusted sources including the National…
Road Rage Statistics
Road rage is caused by drivers expressing extreme aggression with the intent to cause verbal and physical harm to their surroundings. The term road rage gained massive popularity during the 1990s when cases of extreme aggression and anger while driving started trending…
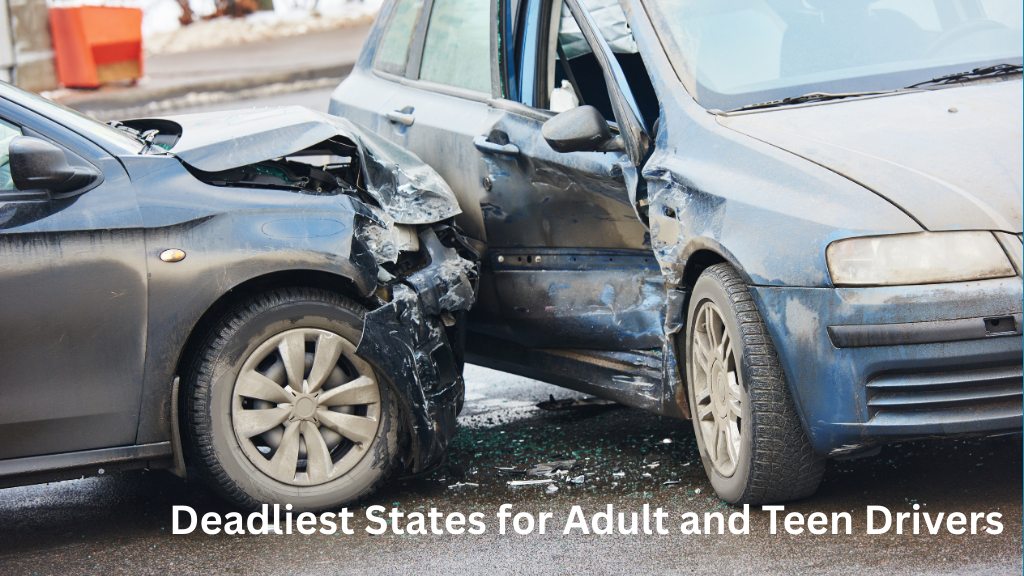
Deadliest States for Adults and Teen Drivers
An estimated 40,990 people were killed in a fatal motor vehicle accident in 2023. This was 3.6% lower when compared to 2022, which had 42,514 car accident deaths. Statistics show that some areas in the United States are deadlier than others. Car…
Statistics & Studies
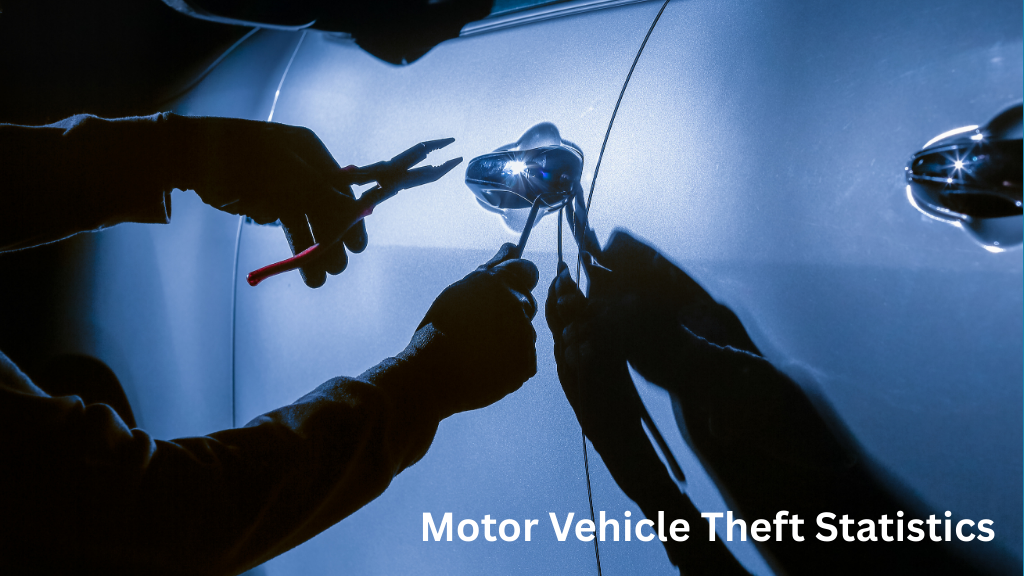
Motor vehicle theft costs the U.S. billions of dollars in losses each year. Motor vehicle theft can be detrimental to most vehicle owners. This is because only comprehensive car insurance can cover a stolen vehicle. The following analysis was created using different…
Distracted Driving
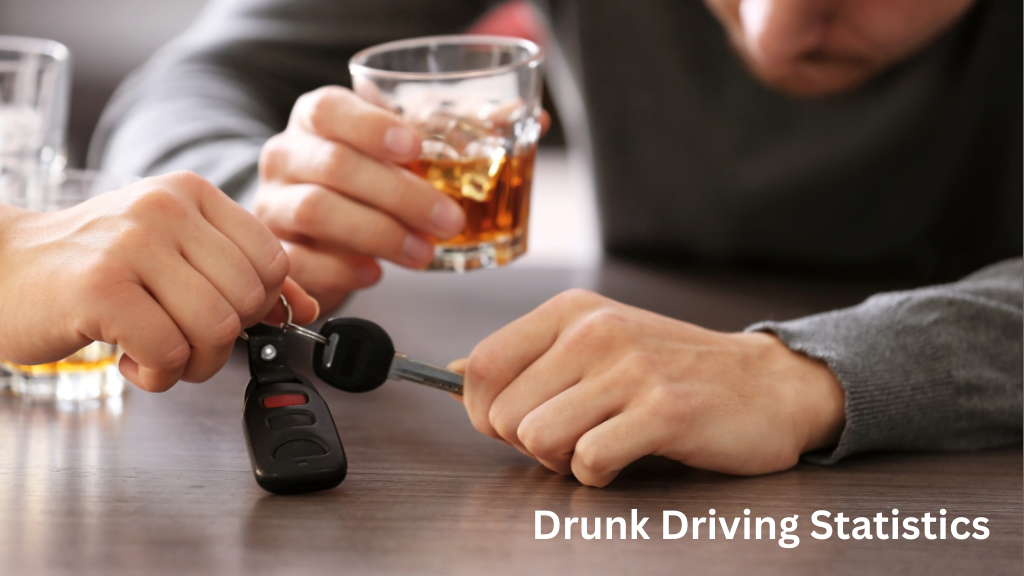
According to statistics, 1 in 3 traffic fatalities in the United States happens as a result of drunk driving. This ratio may vary depending on the state, the age of the driver, and the time of year. This article has compiled the…
Statistics & Studies
Out of $3 trillion in submitted medical claims, an average of $262 billion gets denied each year by healthcare organizations. That is around $5 million per provider. Around 65% of medical claim denials never get resubmitted. This also includes denials regarding commercial…
Distracted Driving
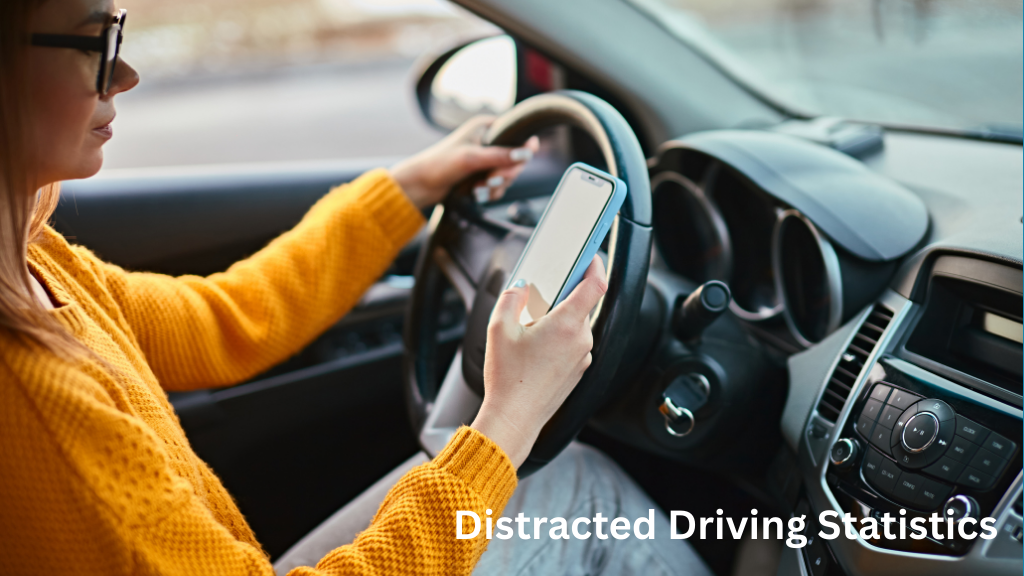
In the early 1980s, Mothers Against Drunk Driving (MADD) brought to public notice; the horrific number of yearly fatalities caused by highly drunk drivers. They discovered that; 80 percent of car accidents involved some distraction -three seconds before an impact occurs. According…
Statistics & Studies
More than 1,300 people die from heat-related illnesses in the United States each year. Most of these deaths occur among people who aren’t being treated for chronic medical conditions, but anyone can succumb to heatstroke if they are exposed to high temperatures…
Statistics & Studies
About 56% of Americans admit that they would rather marry a partner for their financial status than marry for love, according to a study conducted by Merrill Edge. This percentage was almost equal in both men and women, meaning that both sexes…
Distracted Driving
About 7 teens are killed daily in the United States in car-related accidents. Hundreds more are severely injured and treated in the emergency department. Teens ages 15-20 make up 7.8% of all traffic fatalities in the U.S. According to statistics, teen drivers…