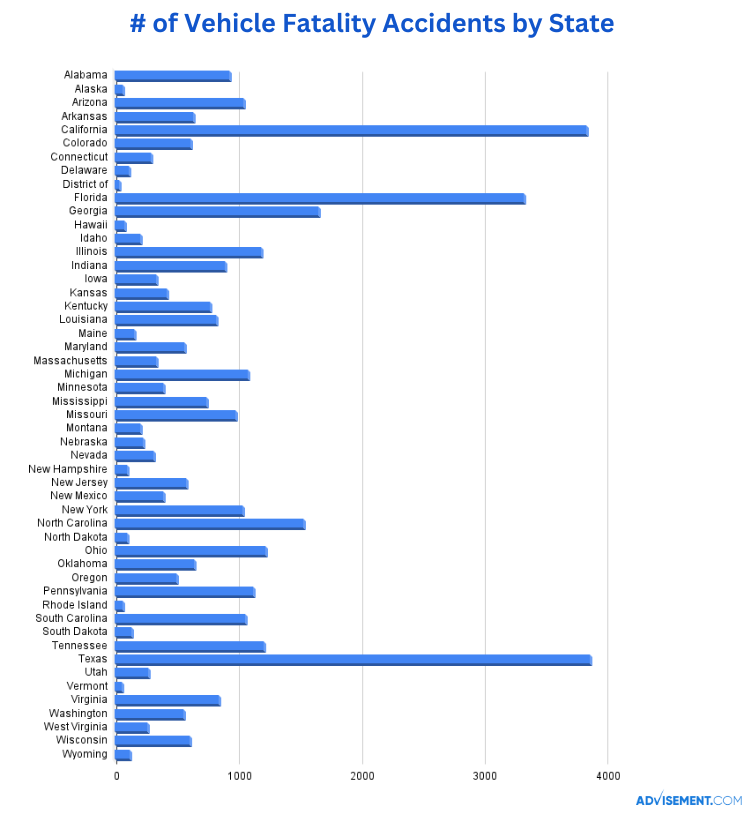
An estimated 42,915 people were killed in a fatal motor vehicle accident in 2021. This was 10% higher when compared to 2020, which had 38,824 car accident deaths. Statistics show that some areas in the United States are deadlier than others.
Car accidents are one of the leading causes of death for adults and teens. For teens, however, driving has resulted to be far more deadly. Fatal car accidents are the leading cause of death for teens in the U.S. with 1 in 3 teen deaths being a result of a car accident.
Table of context:
- How Deadly Are The Deadliest States For Drivers?
- Fatal Car Accidents By State
- Types Of Fatal Accidents
- Fatal Car Crashes By Population
- Chart: Vehicle Fatality Accidents By State/ Miles Driven/ Population
- Frequently Asked Questions
How deadly are the deadliest states for drivers?

In 2022 the U.S. saw a 10% decline in fatal car accident deaths when compared to 2021. Fatal accidents in the deadliest states for drivers range between 1.46 to 1.83 deaths per 100 million miles traveled. The worst states to drive in the U.S. are South Carolina, Mississippi, and Louisiana.
These states are also ranked in the top 3 deadliest states in the nation. South Carolina has the highest deaths per registered vehicle with up to 1.83 per 100,000 million miles as of 2022. It also had the second highest number of car accident deaths by population with up to 20 deaths per 100,000 people.
Fatal Car Accidents by State
The leading cause of driver death is fatal car crashes. In some states in the U.S., the number of fatal crashes can even come close to or be higher than the number of deaths in some years. There is a range of 0.54 – 1.83 deaths per 100 million miles traveled in all 50 states as of 2022. These numbers change depending on the year.
The rankings of the deadliest states, however, haven’t changed as much between 2019 to 2022. The top five deadliest states for adult and teen drivers by miles driven are:
- South Carolina (1.83)
- Mississippi (1.63)
- Louisiana (1.53)
- West Virginia (1.51)
- Kentucky (1.46)
Types of Fatal Accidents

Most states are different when it comes to the type of fatal accident they are the most popular for. Some of the most common types of fatal accidents include side-impact, multiple vehicles, single vehicles, and head-on. On the contrary, there are similar things that lead to these different types of accidents such as speeding, drunk driving, auto defects, and bad weather.
The following list shows the top 10 states with the most fatal vehicle accidents and the number of fatal accidents for each corresponding state as of 2022:
- Texas (3,305)
- California (3,259)
- Florida (2,915)
- Georgia (1,407)
- North Carolina (1,321)
- Pennsylvania (1,103)
- Ohio (996)
- Tennessee (974)
- South Carolina (970)
- Illinois (948)
Fatal Car Crashes by Population

In 2020, the death rate for fatal car crashes was an average of 11.2 per 100,000 people in all 50 states. Despite South Carolina being the deadliest state per 100 million miles driven, Mississippi holds first place for the most deaths per 100,000 inhabitants.
Car accident deaths by population range from 4.9 to 25.4 deaths per 100,000 people in all 50 states. The five deadliest states for adult and teen drivers regarding population are:
- Mississippi (25.4)
- South Carolina (20.7)
- Wyoming (22.0)
- New Mexico (18.8)
- Alabama (18.6)
Vehicle Fatality Accidents by State/ Miles Driven/ Population (IIHS, 2020)
| State | Population | Vehicle miles traveled (millions) | Fatal crashes | Deaths | Deaths per 100,000 population | Deaths per 100 million vehicle miles traveled |
|---|---|---|---|---|---|---|
| Alabama | 5,024,803 | 67,921 | 852 | 934 | 18.6 | 1.38 |
| Alaska | 732,441 | 5,306 | 53 | 64 | 8.7 | 1.21 |
| Arizona | 7,177,986 | 65,758 | 967 | 1,054 | 14.7 | 1.60 |
| Arkansas | 3,012,232 | 33,919 | 585 | 638 | 21.2 | 1.88 |
| California | 39,499,738 | 299,812 | 3,558 | 3,847 | 9.7 | 1.28 |
| Colorado | 5,784,308 | 48,642 | 574 | 622 | 10.8 | 1.28 |
| Connecticut | 3,600,260 | 29,845 | 279 | 295 | 8.2 | 0.99 |
| Delaware | 991,886 | 8,345 | 104 | 116 | 11.7 | 1.39 |
| District of Columbia | 690,093 | 3,030 | 34 | 36 | 5.2 | 1.19 |
| Florida | 21,569,932 | 208,076 | 3,098 | 3,331 | 15.4 | 1.60 |
| Georgia | 10,725,800 | 115,967 | 1,522 | 1,664 | 15.5 | 1.43 |
| Hawaii | 1,451,911 | 8,785 | 81 | 85 | 5.9 | 0.97 |
| Idaho | 1,847,772 | 17,406 | 188 | 214 | 11.6 | 1.23 |
| Illinois | 12,785,245 | 94,121 | 1,087 | 1,194 | 9.3 | 1.27 |
| Indiana | 6,785,644 | 76,608 | 815 | 897 | 13.2 | 1.17 |
| Iowa | 3,188,669 | 29,751 | 304 | 337 | 10.6 | 1.13 |
| Kansas | 2,935,880 | 27,854 | 382 | 426 | 14.5 | 1.53 |
| Kentucky | 4,503,958 | 46,536 | 709 | 780 | 17.3 | 1.68 |
| Louisiana | 4,651,203 | 48,374 | 762 | 828 | 17.8 | 1.71 |
| Maine | 1,362,280 | 13,086 | 151 | 164 | 12.0 | 1.25 |
| Maryland | 6,172,679 | 50,885 | 540 | 567 | 9.2 | 1.11 |
| Massachusetts | 7,022,220 | 54,127 | 327 | 343 | 4.9 | 0.63 |
| Michigan | 10,067,664 | 86,547 | 1,011 | 1,084 | 10.8 | 1.25 |
| Minnesota | 5,707,165 | 51,619 | 369 | 394 | 6.9 | 0.76 |
| Mississippi | 2,956,870 | 39,665 | 687 | 752 | 25.4 | 1.90 |
| Missouri | 6,154,481 | 72,797 | 914 | 987 | 16.0 | 1.36 |
| Montana | 1,086,193 | 12,104 | 190 | 213 | 19.6 | 1.76 |
| Nebraska | 1,961,455 | 19,432 | 217 | 233 | 11.9 | 1.20 |
| Nevada | 3,114,071 | 25,231 | 293 | 317 | 10.2 | 1.26 |
| New Hampshire | 1,377,848 | 11,956 | 98 | 104 | 7.5 | 0.87 |
| New Jersey | 9,279,743 | 66,341 | 547 | 584 | 6.3 | 0.88 |
| New Mexico | 2,117,566 | 23,756 | 365 | 398 | 18.8 | 1.68 |
| New York | 20,154,933 | 102,477 | 963 | 1,046 | 5.2 | 1.02 |
| North Carolina | 10,457,177 | 106,342 | 1,412 | 1,538 | 14.7 | 1.45 |
| North Dakota | 778,962 | 8,768 | 96 | 100 | 12.8 | 1.14 |
| Ohio | 11,790,587 | 103,115 | 1,154 | 1,230 | 10.4 | 1.19 |
| Oklahoma | 3,962,031 | 42,000 | 599 | 652 | 16.5 | 1.55 |
| Oregon | 4,241,544 | 32,298 | 461 | 508 | 12.0 | 1.57 |
| Pennsylvania | 12,989,625 | 87,982 | 1,060 | 1,129 | 8.7 | 1.28 |
| Rhode Island | 1,096,229 | 6,864 | 66 | 67 | 6.1 | 0.98 |
| South Carolina | 5,130,729 | 53,972 | 962 | 1,064 | 20.7 | 1.97 |
| South Dakota | 887,099 | 9,743 | 132 | 141 | 15.9 | 1.45 |
| Tennessee | 6,920,119 | 76,392 | 1,119 | 1,217 | 17.6 | 1.59 |
| Texas | 29,217,653 | 260,582 | 3,520 | 3,874 | 13.3 | 1.49 |
| Utah | 3,281,684 | 30,251 | 256 | 276 | 8.4 | 0.91 |
| Vermont | 642,495 | 6,007 | 58 | 62 | 9.6 | 1.03 |
| Virginia | 8,632,044 | 76,110 | 796 | 850 | 9.8 | 1.12 |
| Washington | 7,718,785 | 53,658 | 525 | 560 | 7.3 | 1.04 |
| West Virginia | 1,789,798 | 16,054 | 249 | 267 | 14.9 | 1.66 |
| Wisconsin | 5,892,323 | 57,600 | 561 | 614 | 10.4 | 1.07 |
| Wyoming | 577,267 | 9,800 | 114 | 127 | 22.0 | 1.30 |
| U.S. total | 331,501,080 | 2,903,617 | 35,766 | 38,824 | 11.7 | 1.34 |


Frequently Asked Questions
Which is the deadliest road in the country?
I-4 is considered one of the deadliest roads to drive in the U.S. The road runs from Tampa, Florida to Daytona Beach, Florida. I-4 has a high death rate per mile driven. This is due to the many challenges drivers have to undergo to cross this road such as driving alongside heavy truckers, construction zones, different speeds, and heavy traffic.
Which is the deadliest highway in the U.S?
The deadliest highway is thought to be in Houston, Texas. The I-45 highway in Texas also battles the I-4 road for its danger. The problem that makes this highway so deadly is the drivers themselves. Houston drivers are proven to have a problem with drunk driving.
Which is the deadliest country for driving in the world?
China and Malaysia are often seen to be even more dangerous for drivers than the U.S. The reason for this is that they are overpopulated. This results in a higher number of fatal vehicle accidents and death.
What is the leading cause of car accident deaths?
According to the National Highway Traffic Safety Administration speeding and drunk driving go head to head for being the leading cause of accident deaths in the nation.
Final thoughts
These statistics also suggest that education, regulations, and enforcement are good points of focus to prevent further driving fatalities in the future. The data shows that more drivers and pedestrians died in the western United States, which may be due to more rural populations.
Lower income areas were shown to have a higher number of fatal crashes as well. As for states with the worst driving conditions, it’s likely no coincidence that many of them also have worse driving laws.


