Auto insurance is required by law by the Department of Motor Vehicles in most states of the U.S. This coverage however, is not bought by everyone that owns or drives a car. Getting into a car accident with an uninsured driver can be detrimental. This is mainly because of the expensive out-of-pocket cost for repairs.
The number of uninsured drivers has dropped over time across the United States, but many motorists still fail to pay the minimums of auto insurance.
The following data and statistics are taken from databases including the National Association Of Insurance Commissioners, the International Rescue Committee, and the Insurance Information Institute.
Table of context:
- How Many Motorists Are Uninsured?
- Uninsured Motorist Statistics
- Percentage Of Uninsured Drivers By State
- States That Require Uninsured/Underinsured Motorist Coverage
How many motorists are uninsured?

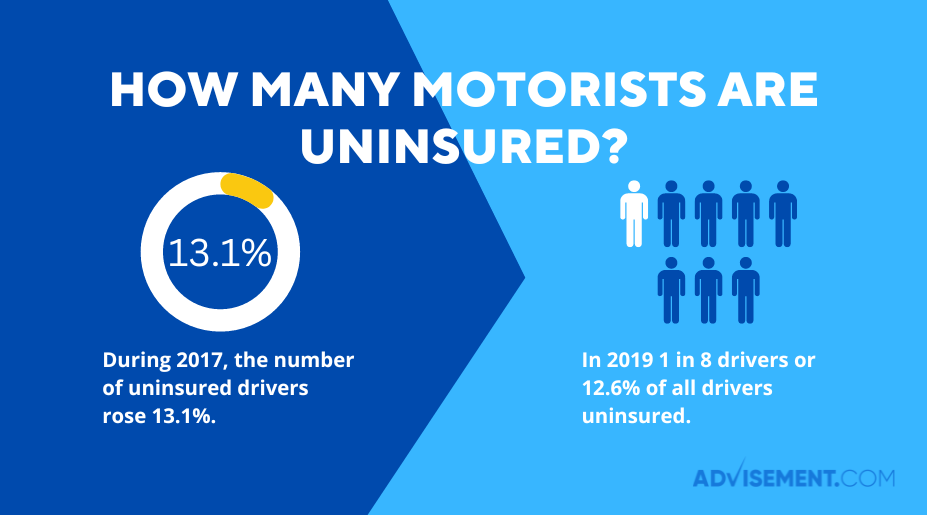
There are around 215 million drivers in the U.S, but a large portion of them still remains uninsured. According to the International Rescue Committee (IRC) there were 32 million uninsured motorists as of 2019. This number makes 1 in 8 drivers or 12.6% of all drivers uninsured.
The number of uninsured motorists were on the rise for nine years in a row up to 2017. During 2017, this number rose 13.1% before it dropped in 2018 and 2019 to the 12.6% it stands as of recently.
The IRC measures uninsurance rates by using a ratio of insurance claims made by those who were injured by uninsured motorists relative to the claims of those that were made by drivers who were injured by insured motorists.
21 states had higher uninsured motorists rates which was more than the nation’s 12.6% average, while 29 states had fewer uninsured rates than the nation’s average.
Uninsured motorist statistics

According to IRC vice president David Corum, uninsured drivers are only raising the cost of insurance for those who are following the law and following their state’s auto insurance requirements. Corum stated that such a thing is not fair and it is keeping insurance rates at a higher price.
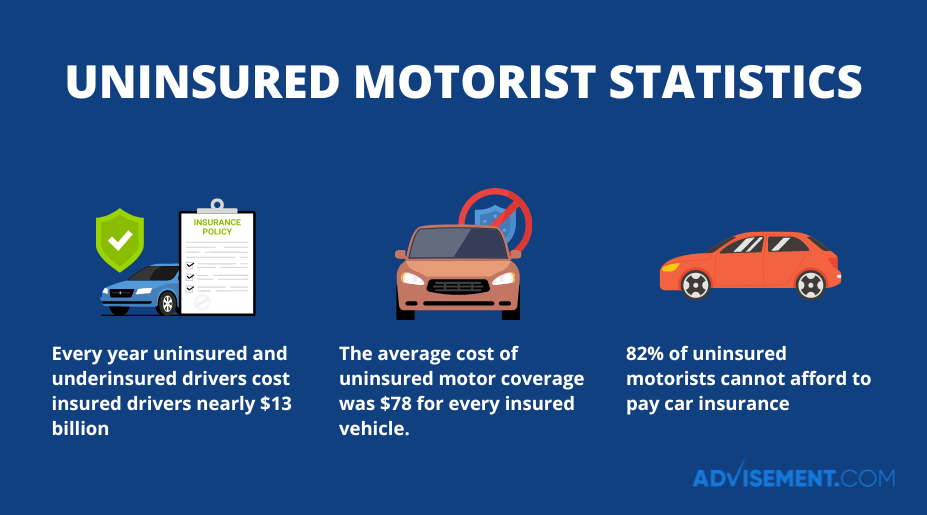
- Both uninsured and underinsured drivers cost insured drivers nearly $13 billion every year.
- 20 states and The District of Columbia require uninsured motor coverage
- The average cost of uninsured motor coverage was $78 for every insured vehicle.
- 82% of uninsured motorists cannot afford to pay car insurance or do not use their vehicle.
Percentage of uninsured drivers by state
As of 2022, District of Columbia has the highest rate of uninsured motorist out of all states, with 25.2% of motorists driving without insurance. DC was followed by New Mexico, Mississippi, and Tennessee.
The states with the lowest percentage of uninsured motorists were Wyoming, with 5.9%, Maine with 6.2%, and Idaho with 6.2% of drivers being uninsured. There have been many shifts in insurance coverage over the years. This coverage also depends on the state of the driver.
Uninsured Motorist Rates by State
| State | Uninsured motorist rates by state |
|---|---|
| DC | 25.2% |
| New Mexico | 24.9% |
| Mississippi | 22.2% |
| Tennessee | 20.9% |
| Michigan | 19.6% |
| Kentucky | 18.7% |
| Georgia | 18.1% |
| Delaware | 18.1% |
| Colorado | 17.5% |
| Ohio | 17.1% |
| California | 17.0% |
| Washington | 16.5% |
| Illinois | 16.3% |
| Missouri | 16.0% |
| Florida | 15.9% |
| Rhode Island | 15.6% |
| Maryland | 15.1% |
| Arkansas | 15.1% |
| Wisconsin | 15.1% |
| Alabama | 14.2% |
| Indiana | 13.9% |
| Texas | 13.8% |
| Louisiana | 13.7% |
| Oregon | 12.3% |
| South Carolina | 12.3% |
| Virginia | 12.1% |
| Arizona | 11.9% |
| Oklahoma | 11.8% |
| Alaska | 11.3% |
| New Jersey | 10.9% |
| Hawaii | 10.9% |
| New York | 10.8% |
| Connecticut | 10.4% |
| North Carolina | 10.3% |
| Iowa | 9.9% |
| Vermont | 9.7% |
| Pennsylvania | 9.6% |
| West Virginia | 8.9% |
| Montana | 8.8% |
| Massachusetts | 8.8% |
| Nevada | 8.8% |
| Minnesota | 8.7% |
| South Dakota | 8.0% |
| Kansas | 8.0% |
| North Dakota | 7.9% |
| Nebraska | 7.8% |
| New Hampshire | 7.8% |
| Utah | 7.3% |
| Idaho | 6.2% |
| Maine | 6.2% |
| Wyoming | 5.9% |


States that require uninsured and underinsured motorist coverage
Most U.S. states do not require uninsured motor coverage. There are only 21 states that currently require this kind of coverage. The amount of money that is required for auto insurance coverage varies by state. Some states, for example, require only property damage coverage, while others require bodily injury coverage.
| State | Uninsured coverage required | Underinsured coverage required | ||||
|---|---|---|---|---|---|---|
| – | Bodily injury per person | Bodily injury per accident | Property damage | Bodily injury per person | Bodily injury per accident | Property damage |
| Connecticut | $25,000 | $50,000 | N/A | $25,000 | $50,000 | – |
| District of Columbia | $25,000 | $50,000 | $5,000; subject to $200 deductible | – | – | – |
| Illinois | $25,000 | $50,000 | – | – | – | – |
| Kansas | $25,000 | $50,000 | – | $25,000 | $50,000 | – |
| Maine | $50,000 | $100,000 | N/A | $50,000 | $100,000 | – |
| Maryland | $30,000 | $60,000 | $15,000 | $30,000 | $60,000 | $15,000 |
| Massachusetts | $20,000 | $40,000 | – | – | – | – |
| Minnesota | $25,000 | $50,000 | – | $25,000 | $50,000 | – |
| Missouri | $25,000 | $50,000 | – | – | – | – |
| Nebraska | $25,000 | $50,000 | – | $25,000 | $50,000 | – |
| New Hampshire | $25,000 | $50,000 | $25,000 | $25,000 | $50,000 | $25,000 |
| New York | $25,000 | $50,000 | – | – | – | – |
| North Carolina | $30,000 | $60,000 | $25,000 | $30,000 | $30,000 | – |
| North Dakota | $25,000 | $50,000 | – | $25,000 | $50,000 | – |
| Oregon | $25,000 | $50,000 | – | – | – | – |
| South Carolina | $25,000 | $50,000 | $25,000 with $200 deductible | – | – | – |
| South Dakota | $25,000 | $50,000 | – | $25,000 | $50,000 | – |
| Vermont | $50,000 | $100,000 | $10,000 with $150 deductible | $50,000 | $100,000 | $10,000 with $150 deductible |
| Virginia | $25,000 | $50,000 | $20,000 with $200 deductible | $25,000 | $50,000 | $20,000 with $200 deductible |
| West Virginia | $25,000 | $50,000 | $25,000 | – | – | – |
Final thoughts
Uninsured/underinsured motorists can be especially problematic for people who have bodily injury claims but not physical damage claims. When this happens, the injured parties may not be able to recover compensation for their injuries, even though they were hurt by an inadequate driver.
These statistics can help inform you about under-served areas of insurance coverage in the marketplace. They can also help raise social consciousness about laws that are designed to protect consumers from uninsured drivers.

