There are amazing figures in space that are beyond what human beings can imagine. Astronomers rely on statistics to describe the size, speed and strength of the universe. The numbers allow us to define the size of the cosmos not only since the age of the universe but also the number of planets outside our solar system.
To teens and young adults, space statistics can transform the complex science to interesting facts that can be remembered and shared easily. These are some of the mind-blowing numbers that show how marvelous our universe is.
1. The Age of the Universe: How Long Has Everything Existed?
Scientists have been studying the cosmic radiation and galaxies which are distant over the decades to ascertain the age of the universe.
The Key Stat:
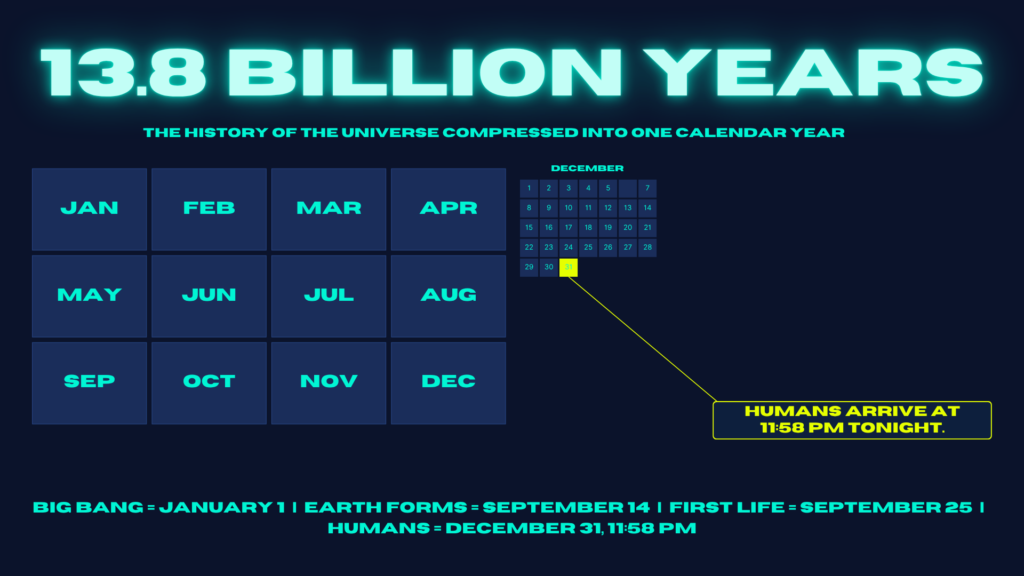
The age of the universe is estimated to be 13.8 billion years.
The “Wow” Factor:
If the entire history of the universe were compressed into one calendar year, modern humans would appear only in the last few minutes of December 31st. On December 25th, dinosaurs would form, and the earliest stars would be formed at the beginning of January.
Why it works:
The fact that billions of years fit into one calendar makes people realize how insignificant human history is in comparison with the lifetime of the universe.
2. The Speed of Space Travel

Space travel is very hard due to the vast distances between space objects. Even the fastest spacecraft that humans have ever made travels slowly in comparison to space distances.
The Key Stat:
The fastest human-made spacecraft, Parker Solar Probe, can travel at around 430,000 miles per hour (692,000 km/h).
The “Wow” Factor:
With the current technology, even traveling at this unbelievable speed, reaching the closest system of stars (Proxima Centauri, 4.2 light-years away) would still require thousands of years.
Why it works:
The comparison of the spacecraft speed and the distances between the stars reveals why interstellar travel has become one of the most challenging things in space exploration.
3. The Milky Way: Our Giant Cosmic Neighborhood
The solar system is contained within the Milky Way galaxy, which is a huge assembly of stars, planets, gas and dust.
The Key Stat:
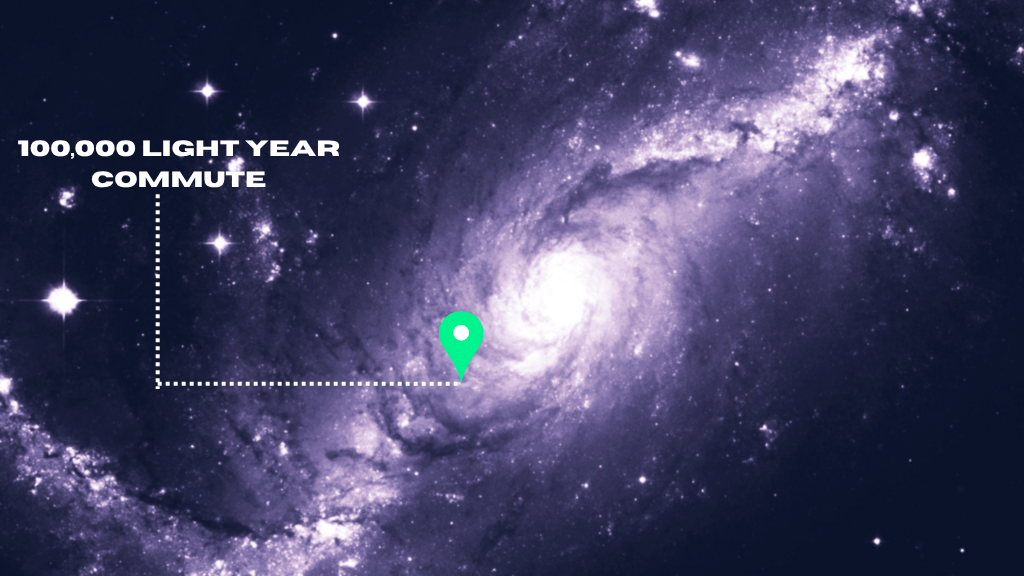
The Milky Way is about 100,000 light-years across.
The “Wow” Factor:
Even at the speed of light, it would take 100, 000 years to make it across the galaxy to the other side. However, our solar system is gently positioned in one of the spiral arms, 27,000 light-years from the center.
Why it works:
Knowledge of the dimensions of our galaxy makes people feel that our solar system is merely a minute component of a bigger conception of the universe.
4. The Coldest and Hottest Places in Space

Some of the extreme temperatures in the world are found in space.
The Key Stat:
Space has an average temperature of approximately -455°F (−270°C), a few degrees below the absolute zero.
The “Wow” Factor:
Space is very cold, but there are stars with temperatures in their cores of tens of millions of degrees. In the meantime, some of the coldest natural places in the universe are still the nebulae and deep spaces.
Why it works:
Extreme temperatures indicate the level of difference between the space environment and that of Earth, which illustrates the difficulties scientists have to deal with when exploring it.
5. Exoplanets: Worlds Beyond Our Solar System

Since ancient times, scientists had been wondering whether there were other stars with planets around them. Thousands of them have been verified by astronomers today.
The Key Stat:
Over 5,000 exoplanets (planets outside our solar system) have been discovered by scientists.
The “Wow” Factor:
Certain of these planets are very unusual. Planets composed primarily of gas, planets twice as large as Jupiter and some of these planets could even have oceans on their entire surface.
Why it works:
The discovery of other planets creates an interest in knowing whether there is life elsewhere in the universe.
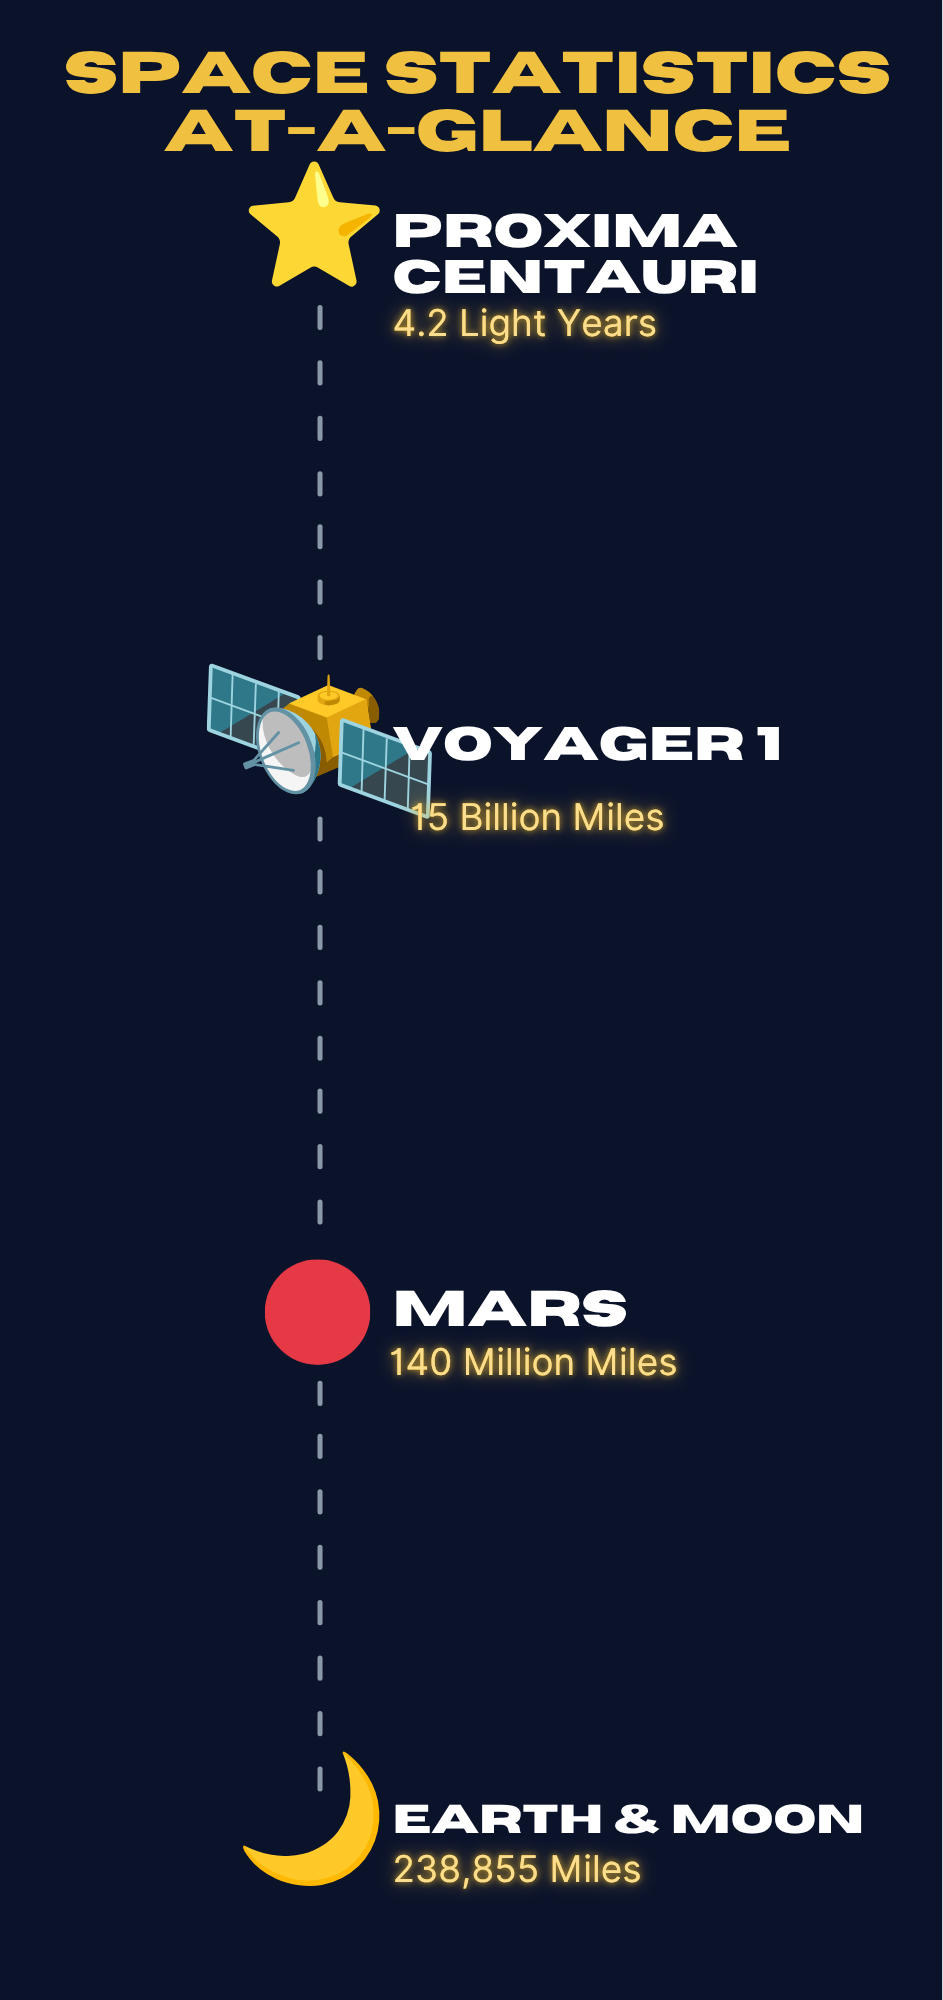
Space Statistics At-A-Glance
| Object | Distance from Earth | Interesting Statistic |
| The Moon | 238,855 miles | Each year, the Moon is slowly drifting off by an average of 1.5 inches compared to the Earth. |
| Mars | 140 million miles (average) | The day on Mars is nearly equal to the day on Earth (24.6 hours). |
| Voyager 1 | Over 15 billion miles | It has gone further away than any other man-made object. |
| Proxima Centauri | 4.2 light-years | The closest known star to our solar system. |
Why These Numbers Matter
In astronomy, statistics assist scientists in knowing how the universe was structured and how it evolved. They tell us about the formation of galaxies, the development of stars and the way in which planets can support life.
These numbers also remind students and young readers of one more important fact: there are still many mysteries in our universe to be discovered.
With each additional telescope, space mission and scientific discovery, more pieces are added to the puzzle. And one day, the future generation of astronomers, perhaps a reader of space today, will be able to discover the next amazing statistic about the universe.