According to statistics, 1 in 3 traffic fatalities in the United States happens as a result of drunk driving. This ratio may vary depending on the state, the age of the driver, and the time of year.
This article has compiled the most up-to-date drunk driving data and statistics from sources including the National Highway Traffic Safety Administration (NHTSA), the Center for Disease Control and Prevention, the National Safety Council, and the National Institute of Health.
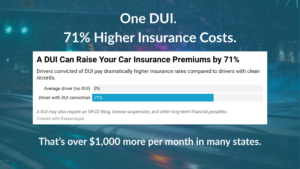
Table of Contents:
- How many people die from drunk during?
- Drunk driving statistics by state
- Drunk driving deaths by age group
- Frequently asked questions about drunk driving
- Drunk driving: A summary of key insights + statistics
How Many People Die from Drunk Driving?
The following information is based on data available from the National Highway Traffic Safety Administration (NHTSA), the Center for Disease Control and Prevention (CDC), Responsibility.org, and a 2020 survey conducted by TheZebra.com
The CDC found that an average of 30 people die each day from drunk driving. If you were to spread the deaths equally in a 24-hour timeframe, that would be about one death occurring every 50 minutes. This means that 10,950 people die on average every year from drunk driving accidents.
The NHTSA on the other hand shows that the number of drunk driving-related deaths has dropped over the last 18 years. This was due to the number of accidents dropping by 14% (mainly because of alcohol prevention laws and the increasing popularity of lift-sharing).
Since 1991, there has been an 35% drop in the number of people that lost their lives due to drunk driving. Even though there has been a 7% increase in deaths from 2011 to 2018, the number has still dropped significantly when compared to the past three decades.
A survey conducted by a car insurance website revealed some interesting statistics when it came to human behavioral patterns and beliefs regarding drunk driving. The study took into question around 1500 drivers of all ages. This study revealed:
- 26% of people say that it takes around 3-4 servings of alcohol for them to feel unsure to drive by themselves.
- 40% of people think that DUI drivers should have their licenses taken away from them temporarily.
- 28% thought that the DUI driver should get their license taken away permanently on the second time caught under the influence.
- 40% called a family member or friend to come and pick them up after a night out of drinking.
- 29% used a lift-share or scooter services (i.e. Lime, Bird) to pick them up after they felt too drunk to drive.
- 10% walked home after a night out drinking.
- 30.5% are aware of their alcohol limits and believe that they don’t have a high tolerance when consuming alcohol.
- 19% of people admit that they have driven at least once while being buzzed.
- 5.5% admitted to driving while buzzed and under the influence of a substance (i.e. marijuana)
Drunk Driving Statistics by State
The following information is based on data available from the National Highway Traffic Safety Administration, the National Institute of Health, and the National Safety Council.
Between the years 2004 and 2018, there were 168,744 registered deaths that were caused due to drunk driving. This number covers 30% of all car accident deaths occurring in that period.
North Dakota had the highest number of car accidents caused by drunk drivers. 40% of all car accident deaths in North Dakota were deaths caused by drunk driving, which is the largest percentage of any state in the U.S.
However, North Dakota has one of the lowest numbers of traffic fatalities overall. That is the reason it holds sixth place for the lowest number of drunk driving deaths from 2004 to 2018. The state that took first place for the highest number of drunk driving deaths in Texas, with over 20,000 deaths.
The District of Columbia holds the lowest number of drunk driving deaths with 152 people killed. Utah only had 19% of drunk driving as the cause of all car accidents that took place in that period. This was the lowest percentage of all 50 states.
| State | Deaths from drunk driving | Percentage of statewide traffic deaths |
|---|---|---|
| United States | 168,744 | 30% |
| North Dakota | 752 | 40% |
| Montana | 1,290 | 39% |
| Texas | 20,292 | 39% |
| Rhode Island | 392 | 38% |
| Connecticut | 1,611 | 38% |
| South Carolina | 5,387 | 38% |
| Hawaii | 646 | 37% |
| Wisconsin | 3,372 | 36% |
| Massachusetts | 1,979 | 35% |
| Delaware | 608 | 34% |
| Washington | 2,642 | 34% |
| Louisiana | 4,086 | 33% |
| Wyoming | 705 | 33% |
| District of Columbia | 152 | 33% |
| South Dakota | 711 | 33% |
| Illinois | 5,323 | 33% |
| Pennsylvania | 6,236 | 31% |
| Alaska | 337 | 31% |
| Missouri | 4,329 | 31% |
| New Hampshire | 585 | 31% |
| Colorado | 2,477 | 30% |
| Oregon | 1,884 | 30% |
| Nevada | 1,458 | 30% |
| Alabama | 4,409 | 30% |
| Mississippi | 3,293 | 30% |
| Virginia | 3,723 | 30% |
| New Mexico | 1,764 | 30% |
| Ohio | 5,101 | 30% |
| Idaho | 1,005 | 29% |
| Maine | 708 | 29% |
| New York | 5,240 | 29% |
| California | 15,193 | 29% |
| North Carolina | 6,041 | 29% |
| Minnesota | 1,835 | 28% |
| Tennessee | 4,575 | 28% |
| Florida | 12,296 | 28% |
| Arizona | 4,057 | 28% |
| Vermont | 295 | 28% |
| Nebraska | 964 | 28% |
| Oklahoma | 2,986 | 28% |
| West Virginia | 1,415 | 28% |
| Arkansas | 2,408 | 28% |
| Michigan | 4,121 | 28% |
| Kansas | 1,631 | 27% |
| Indiana | 3,236 | 26% |
| New Jersey | 2,419 | 26% |
| Iowa | 1,412 | 25% |
| Georgia | 5,381 | 25% |
| Kentucky | 2,841 | 24% |
| Utah | 739 | 19% |
Drunk Driving Deaths by Age Group
The information in this text is based on NHTSA’s Traffic Safety Facts and the Department of Transportation:
Generation Z (ages 16-24) is the most vulnerable generation to get killed in a car accident caused by drunk driving. This generation makes up 36% of alcohol-impaired driving deaths in the U.S.
While 38% of deaths resulted from people aged 25 – 54. This is a much larger demographic than the one described previously, which is why it has resulted in a higher percentage number. When it comes to the older generations, alcohol-impaired deaths were lesser in number, taking up only 15% of all drunk driving deaths. The same goes for people ages 15 or younger, who make up roughly 2.5% of drunk driving deaths.
Frequently Asked Questions About Drunk Driving
Q: Is drunk driving a felony?
A: No. Drunk driving is not a felony but it is a misdemeanor. The penalty of getting caught does not lead to jail time but often results in a fine or community service. The only time drunk driving is considered a felony is when the person is responsible for killing another person while driving under the influence or drunk driving without a license while having a minor in the car.
Q: Which gender is more prone to drive under the influence of alcohol?
A: According to NHTSA, men are overall more likely to drive drunk. Men are 4 times more likely than women to get involved in a car accident while drunk. Men also account for 80% of all traffic fatalities caused by drunk driving.
Q: Which holidays have the most drunk-driving accidents?
A: Over the past two decades, there were more drunk driving accidents during the 4th of July and Thanksgiving than there were on any other holiday. Around 40% of all holiday accidents occurred on these two specific holidays.
Q:How does drunk driving affect car insurance?
A: Getting a DUI might increase insurance. For the U.S’s 10 largest states, insurance may increase by $3,500 after being convicted of a DUI. This results in a 123% increase in the average cost of insurance.
A Summary of Key Insights + Statistics
Drunk Driving Traffic Fatality Statistics:
- 290,000 people are injured from drunk driving traffic fatalities each year.
- $130 billion is the average amount that drunk driving costs the U.S.
- A 0.10 Blood Alcohol Content (BAC) makes it 7 times more likely for a drunk driver to get involved in a traffic fatality.
- Out of 56000 traffic fatalities that occur on the road, 22% of them are caused by drunk driving.
- 1 in every 5 college students driven drunk at least once.
- 10,000 Americans are killed annually by drunk drivers. 1000 Americans killed by drunk drivers are children.
Drunk Driving Prevention Statistics:
- Ridesharing caused a 4% drop in drunk driving deaths and reduced traffic fatalities by up to 6%.
- 31,959 lives have been saved since the minimum drinking age (21+) was put in power by the State Congress.
- For one DUI charge, there are 500-2000 cases of drunk drivers that go unpenalized.
Final Thoughts
Most statistics are truly alarming, but the good news is that drunk driving deaths are dropping considering the rapid growth of the population. For years the battle with alcoholism has been viewed as hopeless by many people.
However, in recent times, we have seen great strides taken in awareness and education of alcoholism and substance abuse which has significantly helped in reducing drunk driving accidents and deaths!