Divorce can happen at an alarming rate. Most people think it will never happen to them. These numbers show how that’s not always the case.
Divorce Trends Over Time
The US Census provides details on what happens to the marriage rate over time.
- In 2012, there were 16.6 marriages per 1000 people.
- In 2022, there were 16.7 marriages per 1000 people.
- There are 2,065,905 married people in the US.
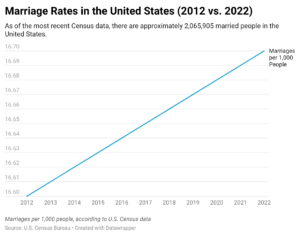
That’s not indicating must difference in the number of people getting married. The divorce rate is high:
- The divorce rate is 2.4 per 1000 people.
Divorce Rates by State
|
Divorce Rates by State as of 2023 |
|
| State | Divorce Rate |
| Alabama | 10.04% |
| Alaska | 8.98% |
| Arizona | 9.79% |
| Arkansas | 10.51% |
| California | 7.45% |
| Colorado | 9.65% |
| Connecticut | 8.81% |
| Delaware | 9.24% |
| District of Columbia | 6.98% |
| Florida | 10.81% |
| Georgia | 8.95% |
| Hawaii | 7.31% |
| Idaho | 9.52% |
| Illinois | 7.85% |
| Indiana | 9.96% |
| Iowa | 8.68% |
| Kansas | 8.96% |
| Kentucky | 10.62% |
| Louisiana | 9.30% |
| Maine | 11.84% |
| Maryland | 8.09% |
| Massachusetts | 7.84% |
| Michigan | 9.52% |
| Minnesota | 8.25% |
| Mississippi | 9.21% |
| Missouri | 9.84% |
| Montana | 10.48% |
| Nebraska | 8.16% |
| Nevada | 11.27% |
| New Hampshire | 9.88% |
| New Jersey | 7.03% |
| New Mexico | 10.79% |
| New York | 7.28% |
| North Carolina | 8.84% |
| North Dakota | 7.43% |
| Ohio | 9.81% |
| Oklahoma | 10.49% |
| Oregon | 10.60% |
| Pennsylvania | 8.02% |
| Rhode Island | 9.26% |
| South Carolina | 8.75% |
| South Dakota | 8.55% |
| Tennessee | 9.97% |
| Texas | 8.22% |
| Utah | 6.78% |
| Vermont | 10.61% |
| Virginia | 8.23% |
| Washington | 9.33% |
| West Virginia | 11% |
| Wisconsin | 8.91% |
| Wyoming | 9.89% |
Divorce Rates by Country
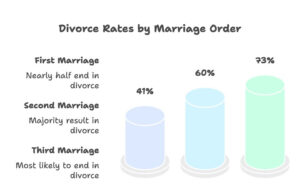
Across the U.S., the American Psychological Association has a startling fact to share.
- 41% of first marriages are likely to end in divorce. That’s data from 2024.
- About 60% of second marriages end in divorce.
- 73% of third marriages don’t make it.
- A peak of divorces happens during the 5th year.
- The second peak of divorces happens in the 15th to 20th year of marriage.
The reason? Raising children. Many people who raise children consider divorce after those children have left the home.
Divorce Rates by Occupation
Where you work matters. So does your field. A Monster survey found the following:
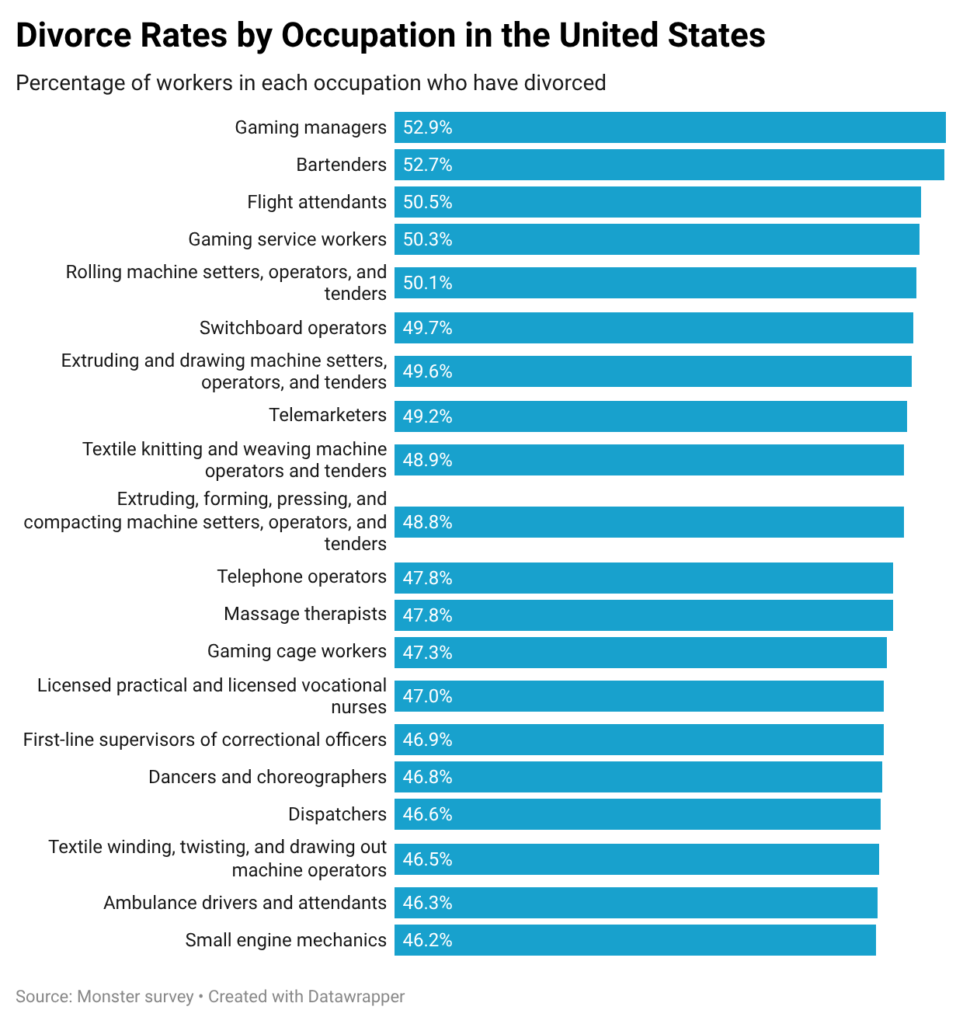
- Gaming managers 52.9%
- Bartenders 52.7%
- Flight attendants 50.5%
- Gaming service workers 50.3%
- Rolling machine setters, operators, and tenders 50.1%
- Switchboard operators 49.7%
- Extruding and drawing machine setters, operators, and tenders 49.6%
- Telemarketers 49.2%
- Textile knitting and weaving machine operators and tenders 48.9%
- Extruding, forming, pressing, and compacting machine setters, operators, and tenders 48.8%
- Telephone operators 47.8%
- Massage therapists 47.8%
- Gaming cage workers 47.3%
- Licensed practical and licensed vocational nurses 47%
- First-line supervisors of correctional officers 46.9%
- Dancers and choreographers 46.8%
- Dispatchers 46.6%
- Textile winding, twisting, and drawing out machine operators 46.5%
- Ambulance drivers and attendants 46.3%
- Small engine mechanics 46.2%
Divorce Rates by Income
The American Community Survey found:
- 75% of all divorces are in those who have an income under $100,000
- 11% of divorces had an income above $150,000
Divorce Rates by Age
Age can be a factor in divorce.
- 48% of people who marry before 18 will divorce in 10 years.
- 25% of those who marry after the age of 25 divorce.
- Those who wait to marry until after 25 are 24% less likely to divorce.
Divorce Rates by Gender
US Census data shows a correlation between when divorce happens and income.
- In heterosexual marriages, where a female is the main earner, the risk of divorce is three times higher. It is 31 per 1000 marriages.
- Alternatively, it is 11 per 1000 marriages when a man earns more.
- 69% of all divorces are initiated by women. 31% are started by men.
Divorce Rates by Race
According to a study by Bowling Green State University, divorce rates for men by race are as follows:
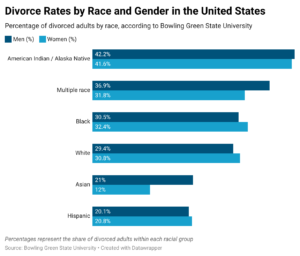
- Asian: 21.0%
- Hispanic: 20.1%
- White: 29.4%
- American Indian Alaskan Native: 42.2%
- Black: 30.5%
- Multiple race: 36.9%
For women it was as follows:
- Asian: 12.0%
- Hispanic: 20.8%
- White: 30.8%
- American Indian Alaskan Native: 41.6%
- Black: 32.4%
- Multiple race: 31.8%
Divorce Rates by Education Level
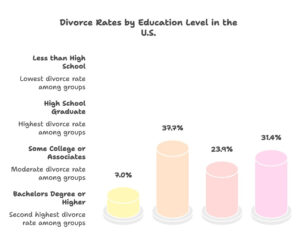
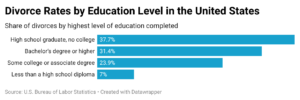
Education level plays a role, too. The U.S. Bureau of Labor Statistics shows this:
- Less than a high school diploma: 7.0% of all divorces
- High school graduate, no college: 37.7% of all divorces
- Some college or an associates degree: 23.9% of all divorces
- Bachelors degree or higher: 31.4% of all divorces
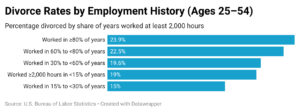
Another factor involves employment history. The study looked at employment history for people between 25 and 54 years of age. It should:
- Those who worked at least 2,000 hours in less than 15% of years: 19% divorced
- With 15 to less than 30% of years: 15.0% divorced
- With 30 to less than 60% of years: 19.6% divorced
- With 60 to less than 80% of years working: 22.5% divorced
- With those working at least 80% of years married: 23.9% divorced.
Divorce Rates by Religion
According to Pew Research, different religions do have varying levels of divorce occurring.
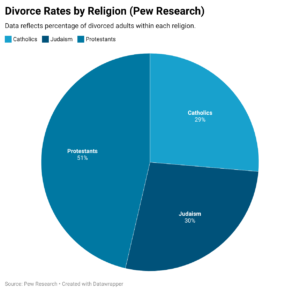
- Protestants: 51%
- Catholics: 29%
- Judaism: 30%
Divorce With Children
- Approximately 50% of all children under the age of 18 will witness a divorce
Divorce Settlements
Settlement information isn’t always available. Many divorce settlements remain private. That’s the case when those settlements happen in private. Divorces that go to court have different factors. Consider these stats from Forbes:
- $15,000 is the average cost of divorce. That assumes a simple divorce.
- $100,000 is the average cost of a divorce in a litigated case. These are more complex cases.
- 86% of people who were married for 5 years or less were married while in debt. Finances are the biggest driver of divorce in those individuals.
- The average woman’s household income drops by 41% after divorce. That is twice the drop men have.
- The average cost of a divorce lawyer is $270 per hour.

